YIELD
Territory Command

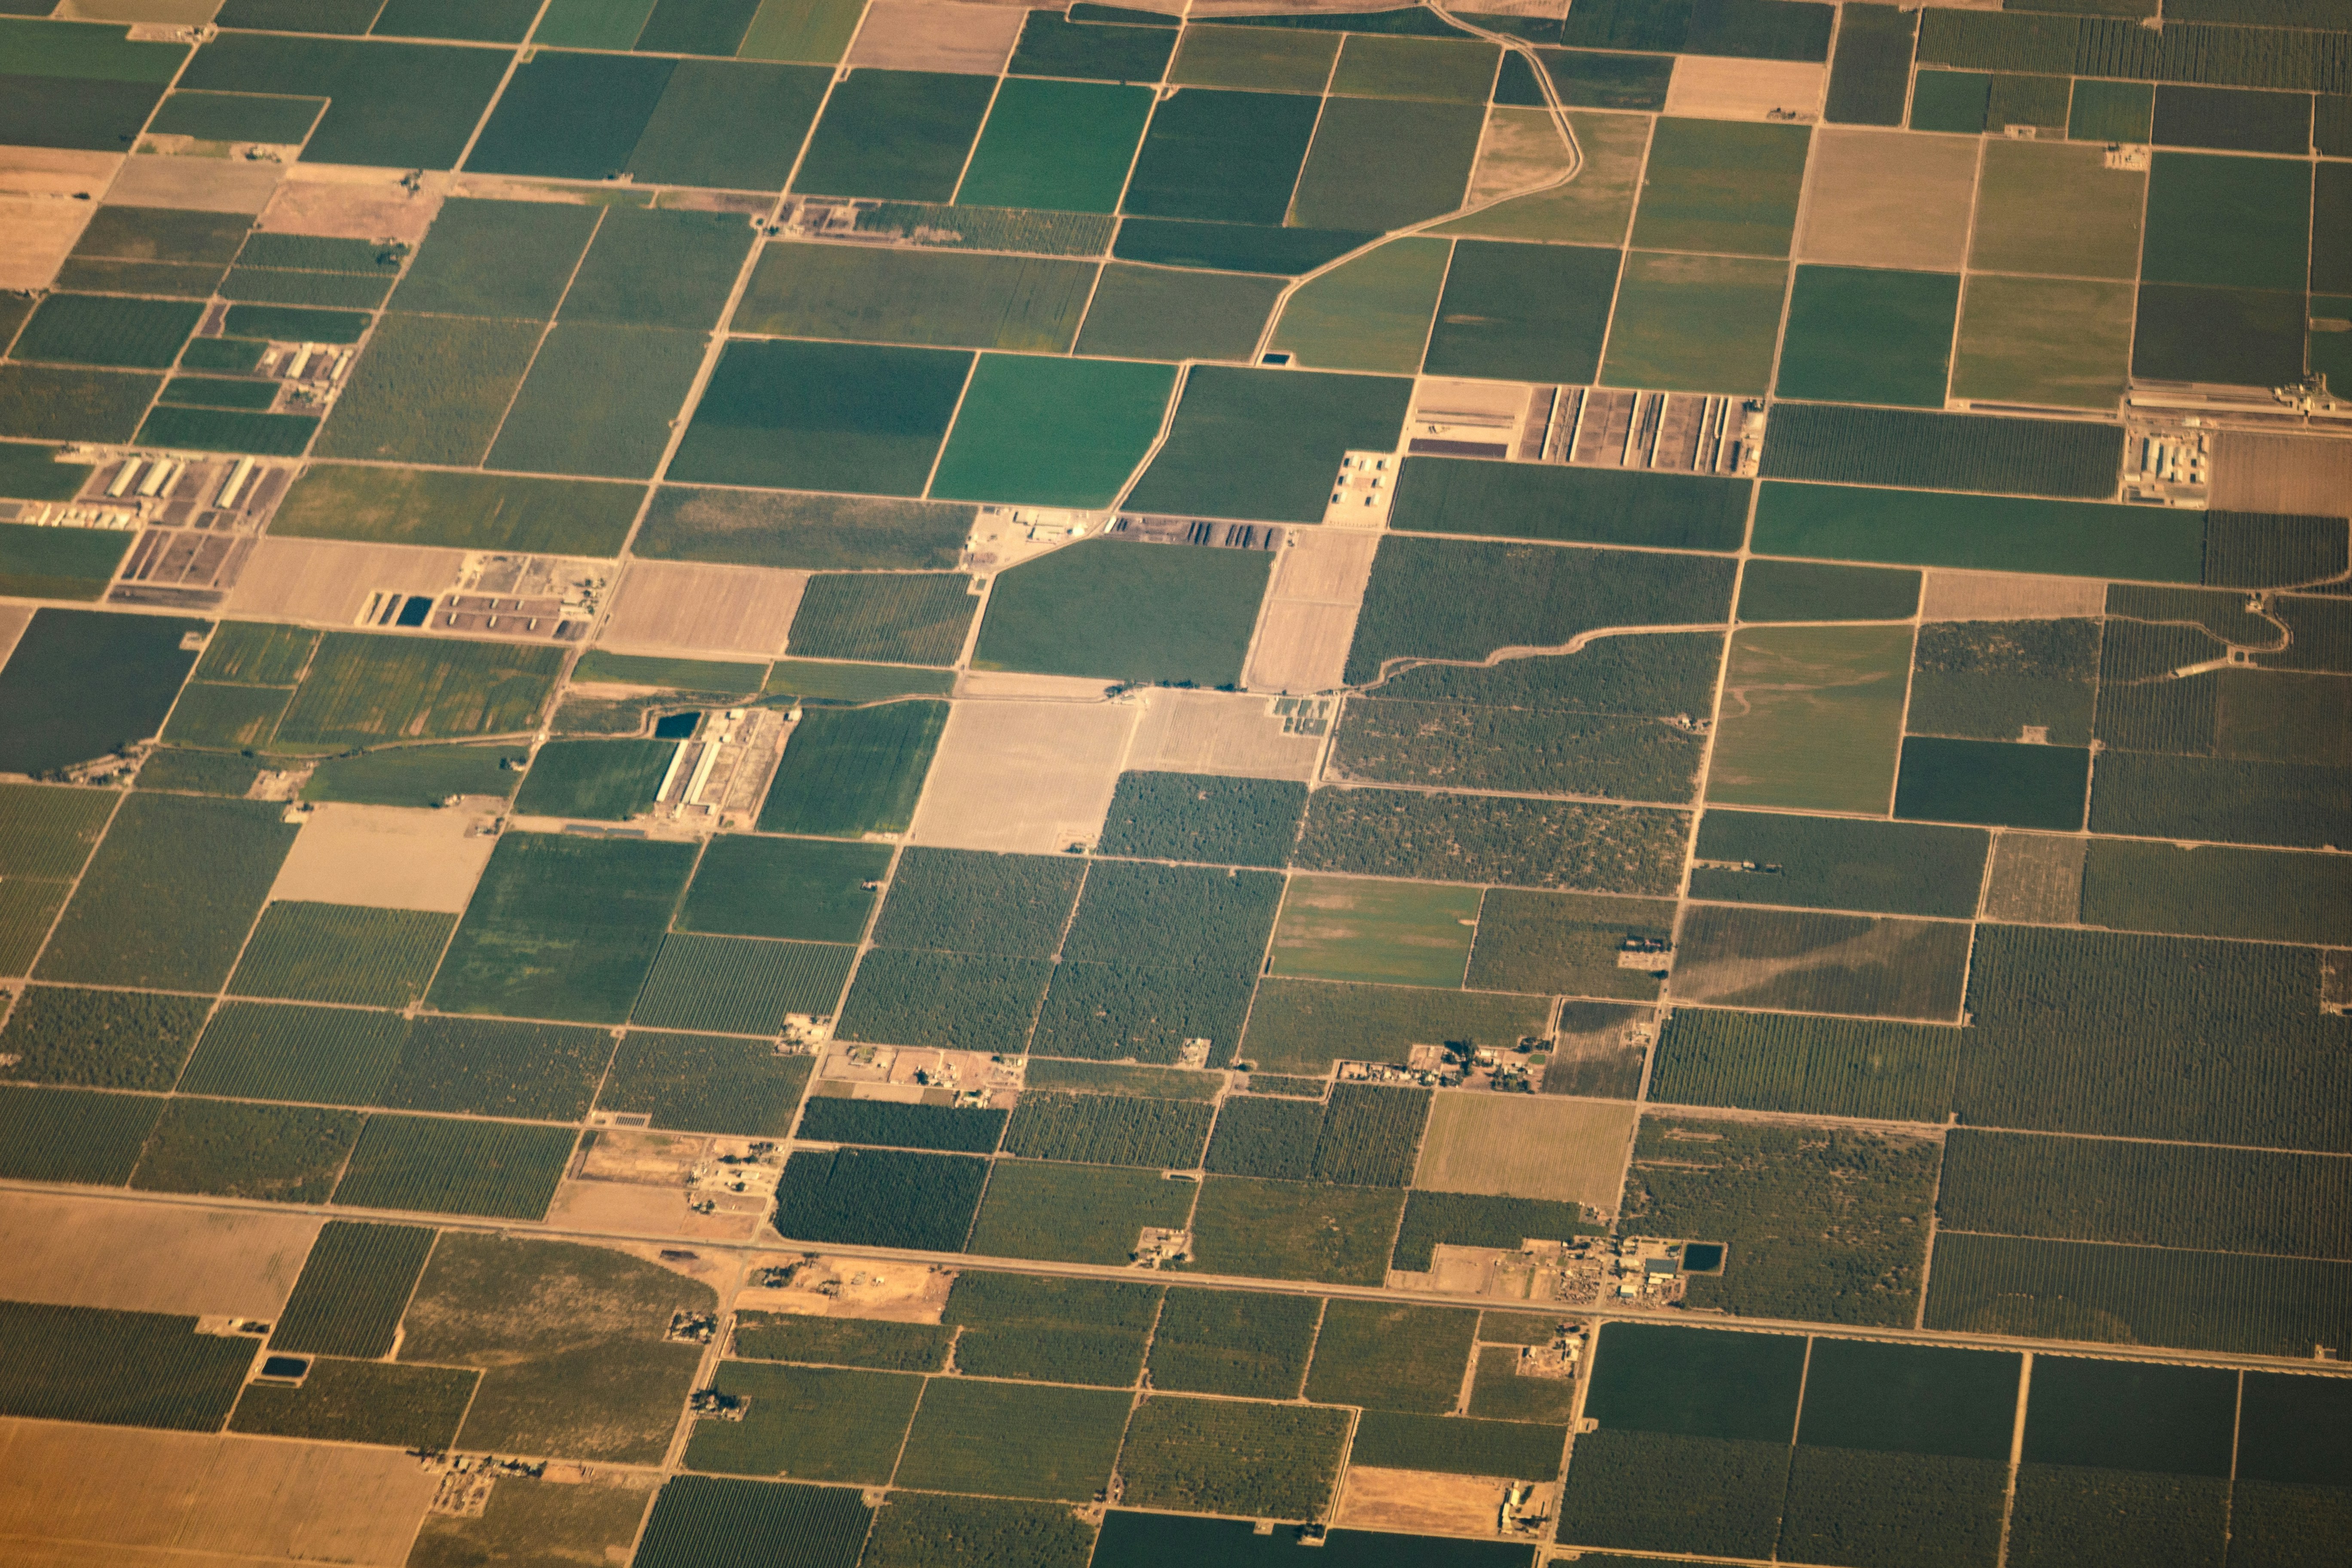
Every acre. Every account. One map.
Dealer pins update in real time as your team logs touchpoints. Color-coded by pipeline stage — green is active, amber is at-risk, red needs a call today.
Forecast by crop cycle, not calendar quarter.
Planting-season spikes don't look like Q2 in a spreadsheet. Yield speaks ag.
Know which touchpoints closed the deal.
From first call to combine cab — every revenue dollar traced back to the rep, the visit, and the season.
200 dealer relationships. Zero dropped balls.
Automated follow-up cadences triggered by crop-stage milestones. If a dealer hasn't heard from you in 8 days before planting, Yield flags it before you lose the season.
Works with the ERP you already have.
Pull from Agrian, Conservis, or SAP Ag. Yield maps your data — you don't re-enter a single row.
See Your Territory
Live
Pre-load your territory with dealer data in under 4 minutes. No import required — we map your accounts on first login.
Not ready for a demo?
Download the 2026 Ag Sales Benchmark Report — 34 pages of data on CRM adoption, pipeline velocity, and harvest-cycle revenue across 600 ag reps in the Midwest.
“I went from managing 200 accounts in a spreadsheet to seeing every dealer's pipeline stage on one map. First week, I recovered a $62K deal I didn't know was slipping.”
“We track member engagement through planting and harvest now. The seasonal pipeline view alone paid for the platform in month two.”